Underwrite non-QM and portfolio mortgages on what the grid can't see
A rate sheet sees a credit score, an LTV and a DTI. It cannot see twelve months of deposits, a tradeline pattern, or how your own book actually performed. Underwrite.ai puts a trained model beside the grid on every file — and shows you exactly where the two disagree, and why.
No integration required to start. A spreadsheet of closed loans is enough.
Agency fields are exhausted just under 0.80
We measured it rather than asserting it. Starting from credit score alone, each additional block of agency-observable data adds discrimination — and then stops. Everything past that point has to come from somewhere the GSE record does not reach: cash flow, tradeline behaviour, documentation type, and ultimately your own outcomes.
That is the whole thesis, and it is why the platform is built to ingest bank statements and credit detail rather than to re-rank the same four fields.
What we do not claim: every figure on this ladder comes from agency data only, because the public loan-level datasets carry no bank statements. We have no validated number for what cash flow adds on top, and we would rather say so than publish one. Measuring it takes a book where both the cash-flow detail and the outcomes exist, which is one of the things a retrospective on your own loans produces.
- 0.751Credit score alone
- 0.777+ LTV and DTI — the conventional rate-sheet grid
- 0.779+ loan structure: term, purpose, occupancy, units, channel
- 0.796+ every remaining GSE-observable field. The ceiling of agency data, and where this model sits today
AUC for 24-month default. Trained on 10,049,670 Freddie Mac single-family originations from 2016 to 2020, measured on 100,000 loans from the 2021 and 2022 vintages held out of training. Higher is better; 0.5 is a coin flip. AUC is specific to the population it is measured on and does not transfer between books.
A decision your credit committee and your examiner can both follow
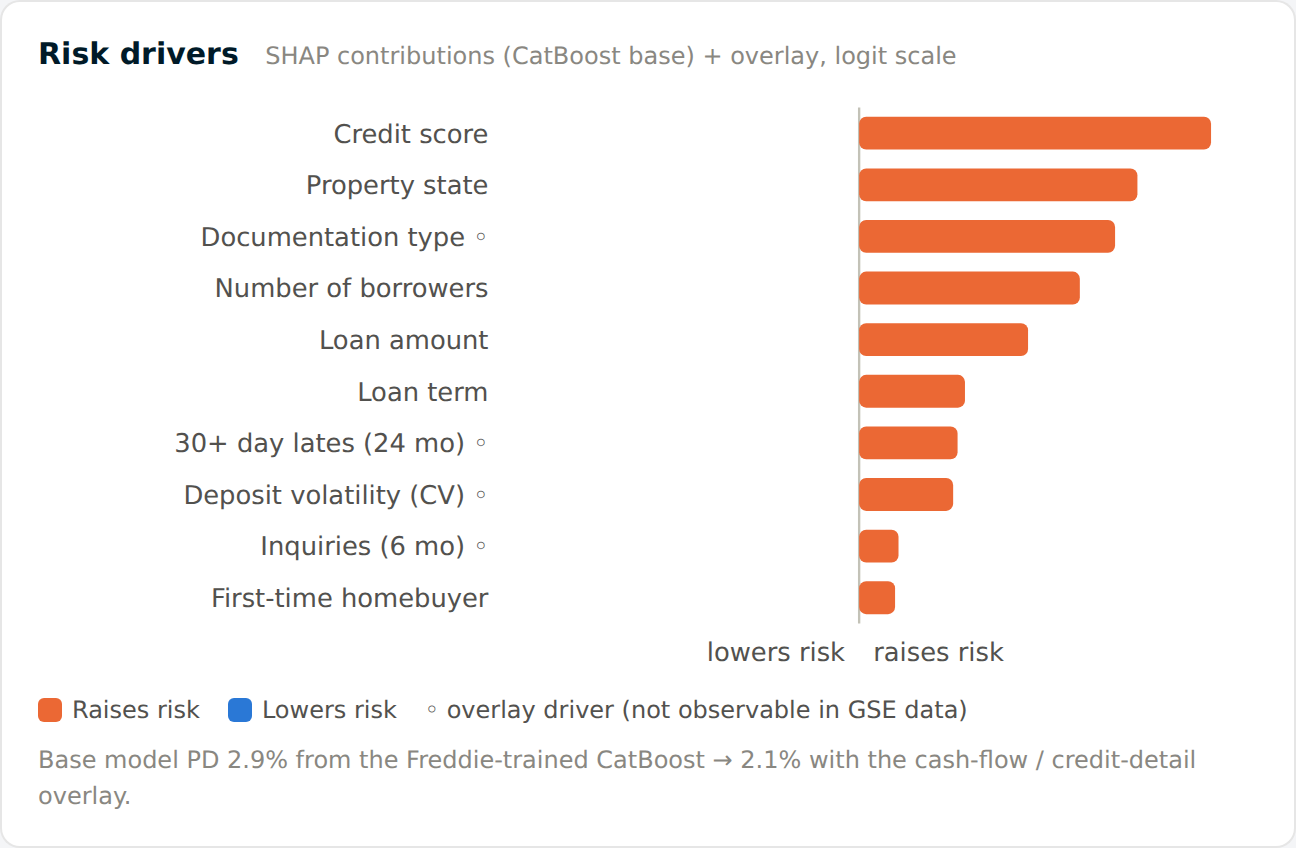
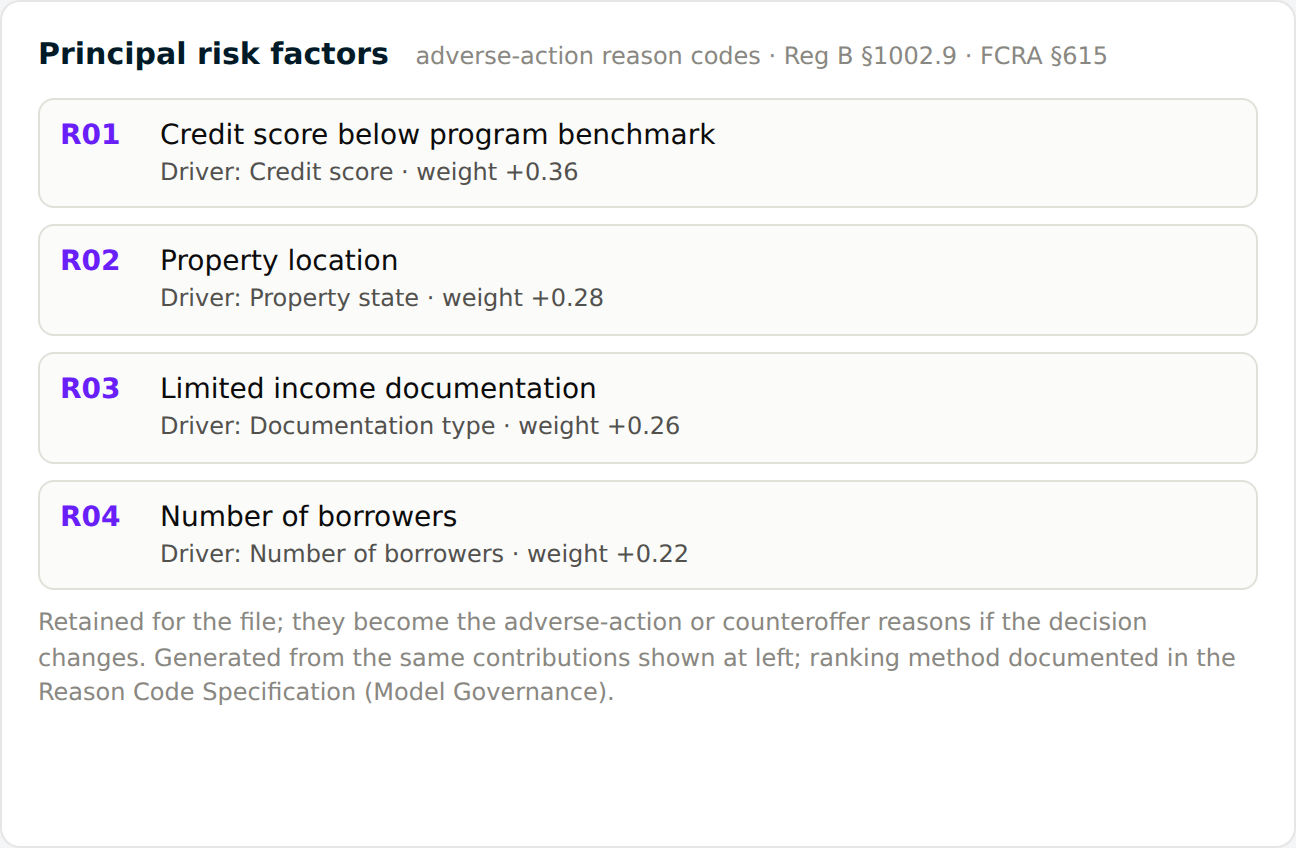
Each file returns a probability of default, an early-payment-default estimate, a risk grade and the ranked drivers behind them — with the model version and timestamp stamped on the record, so any decision can be reproduced months later exactly as it was made.
Risk and eligibility, kept separate
The model estimates loss. The guidelines decide eligibility. Both are shown, and a file can be an excellent risk that still refers on a policy exception — with the exception, its band and its rationale on the record.
What-if, through the same engine
Move loan amount, reserves, debts or score and the file re-scores live. It is the same code path as the decision, so a committee can test a restructure without asking anyone to re-underwrite by hand.
Conditions and findings
Guideline findings list the rule and the shortfall. Conditions are generated per program, cleared against documents as they arrive, and every clearance records the evidence that satisfied it.
For a self-employed borrower, income is the whole underwrite
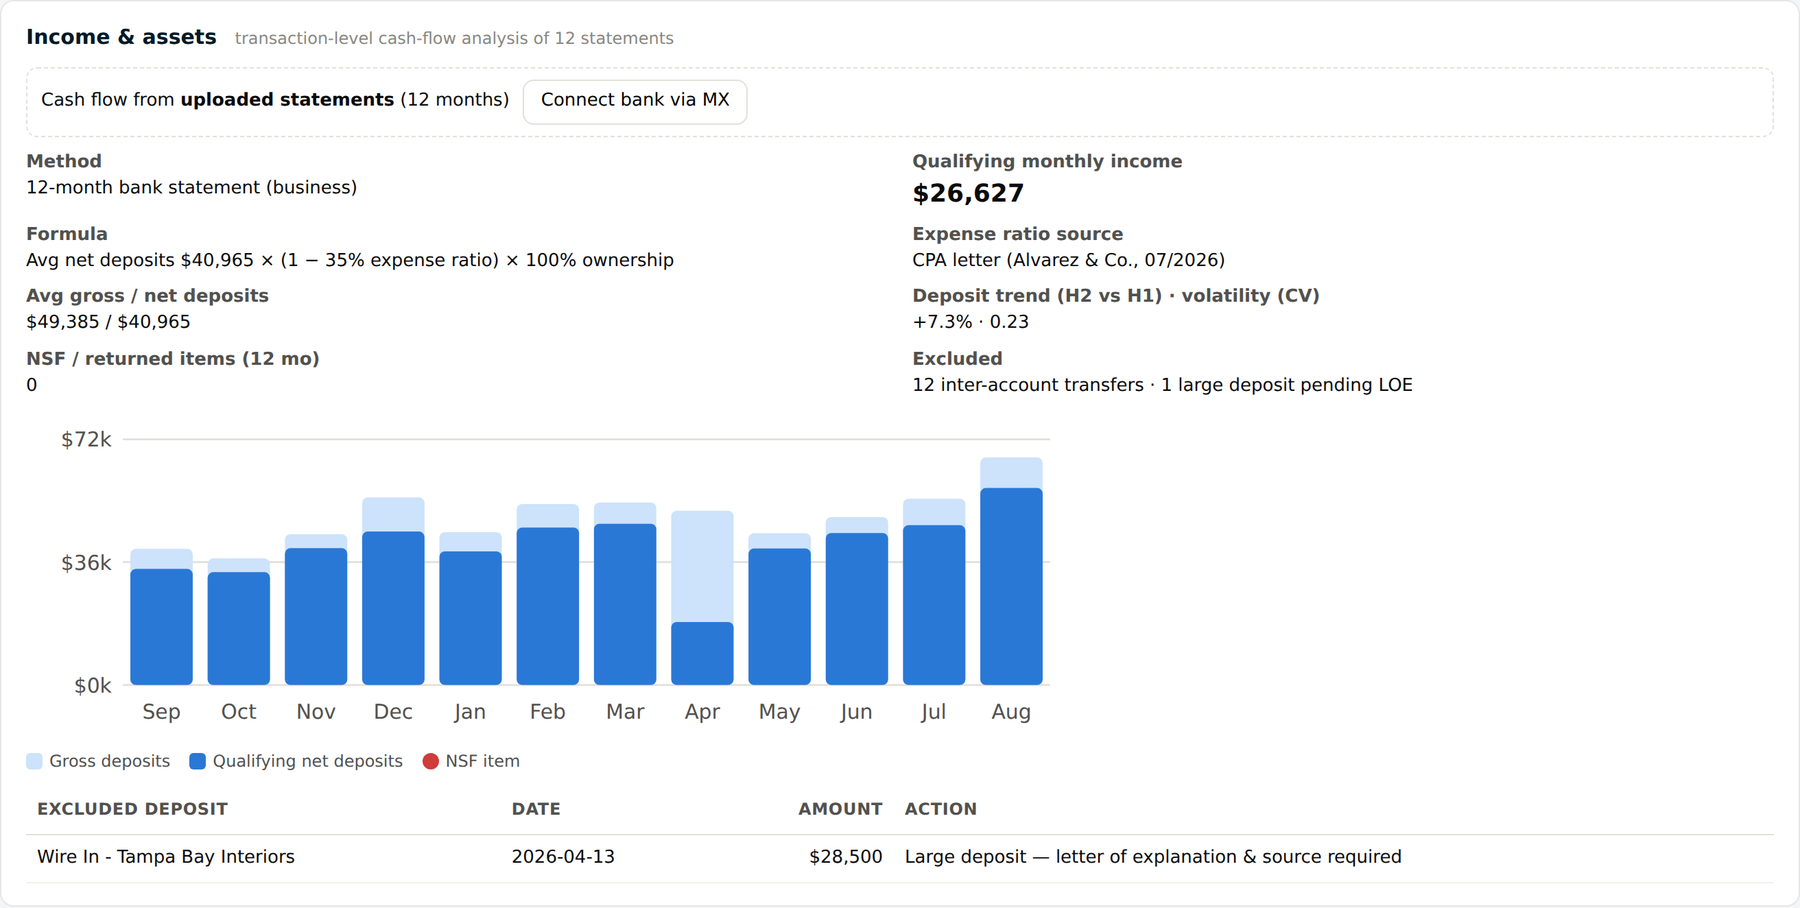
Twelve months of deposits, read transaction by transaction. Inter-account transfers stripped out because they are not income. Large deposits excluded and held against a letter of explanation. Expense ratio taken from the CPA letter in the file rather than a program default.
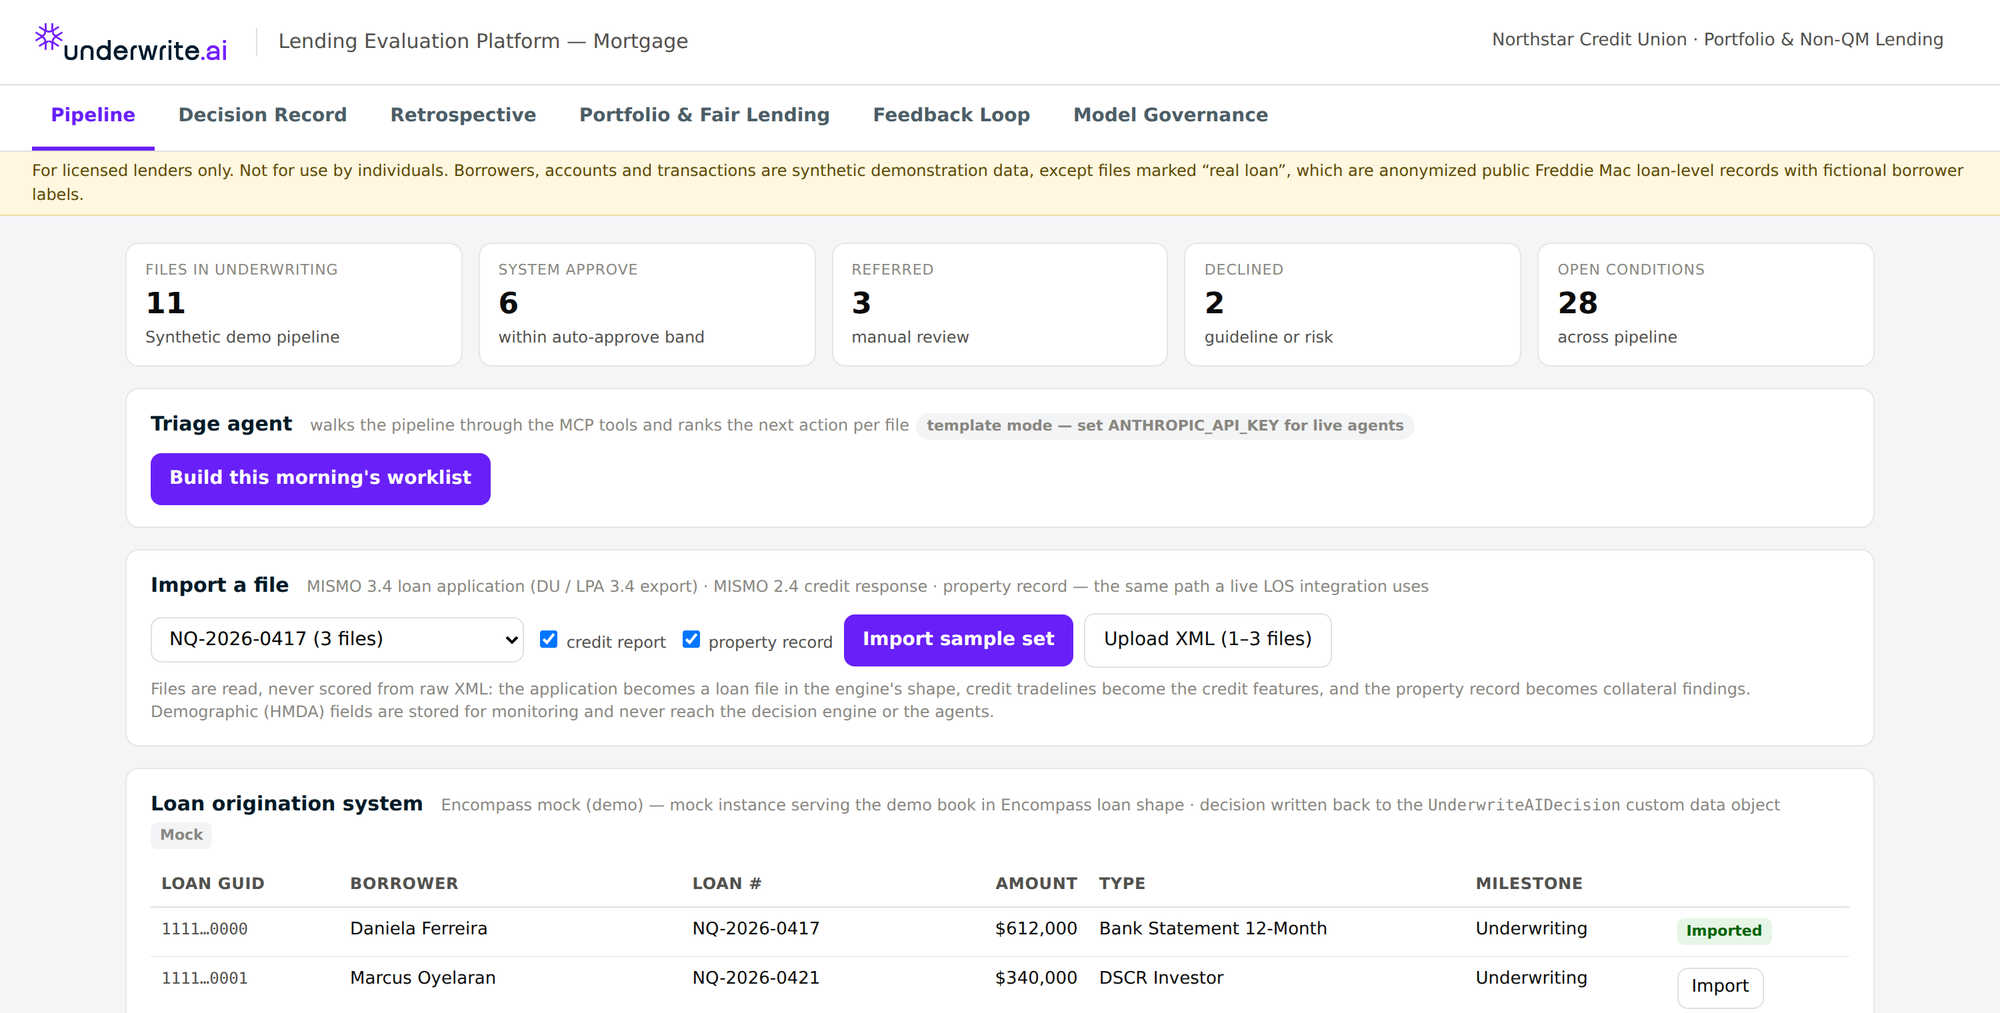
- Bank statement, full doc, DSCR and asset depletion — each with its own documented formula, shown on the file.
- Deposit trend, volatility and NSF count computed and surfaced, not buried in a spreadsheet.
- Statements or a direct account connection. Borrowers can link accounts through MX; the same income engine then runs on account-sourced transactions, with no PDFs to tamper with.
- Documents read with citations. Paystubs, W-2s, tax returns, CPA letters and binders are extracted with page and bounding-box references, then reconciled against the application.
Before you integrate anything, run it on loans you have already closed
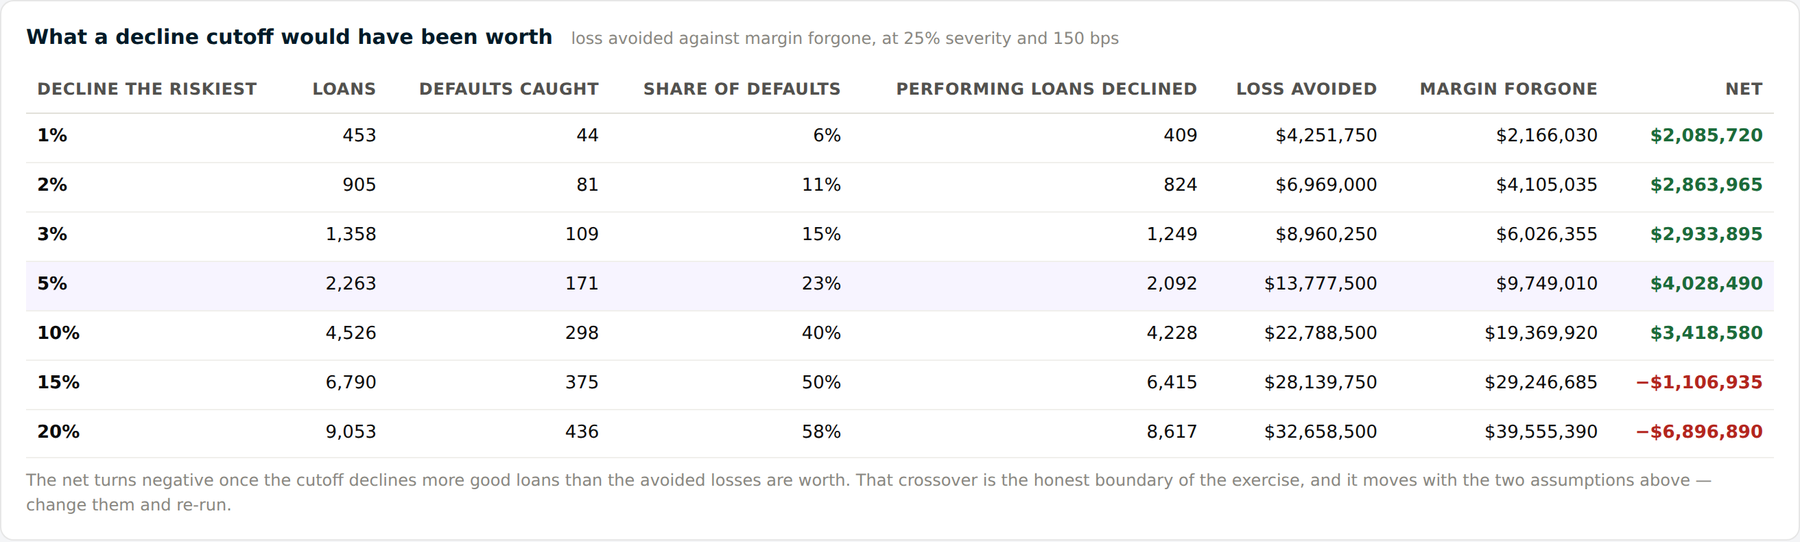
Send a spreadsheet of closed loans — origination attributes, and what each loan went on to do. Every file is scored as of its origination date, using only the fields that existed when it was underwritten, and the score is compared against the outcome. Three questions get answered with your own data: does the model rank your book, is it calibrated to it, and what would that have been worth.
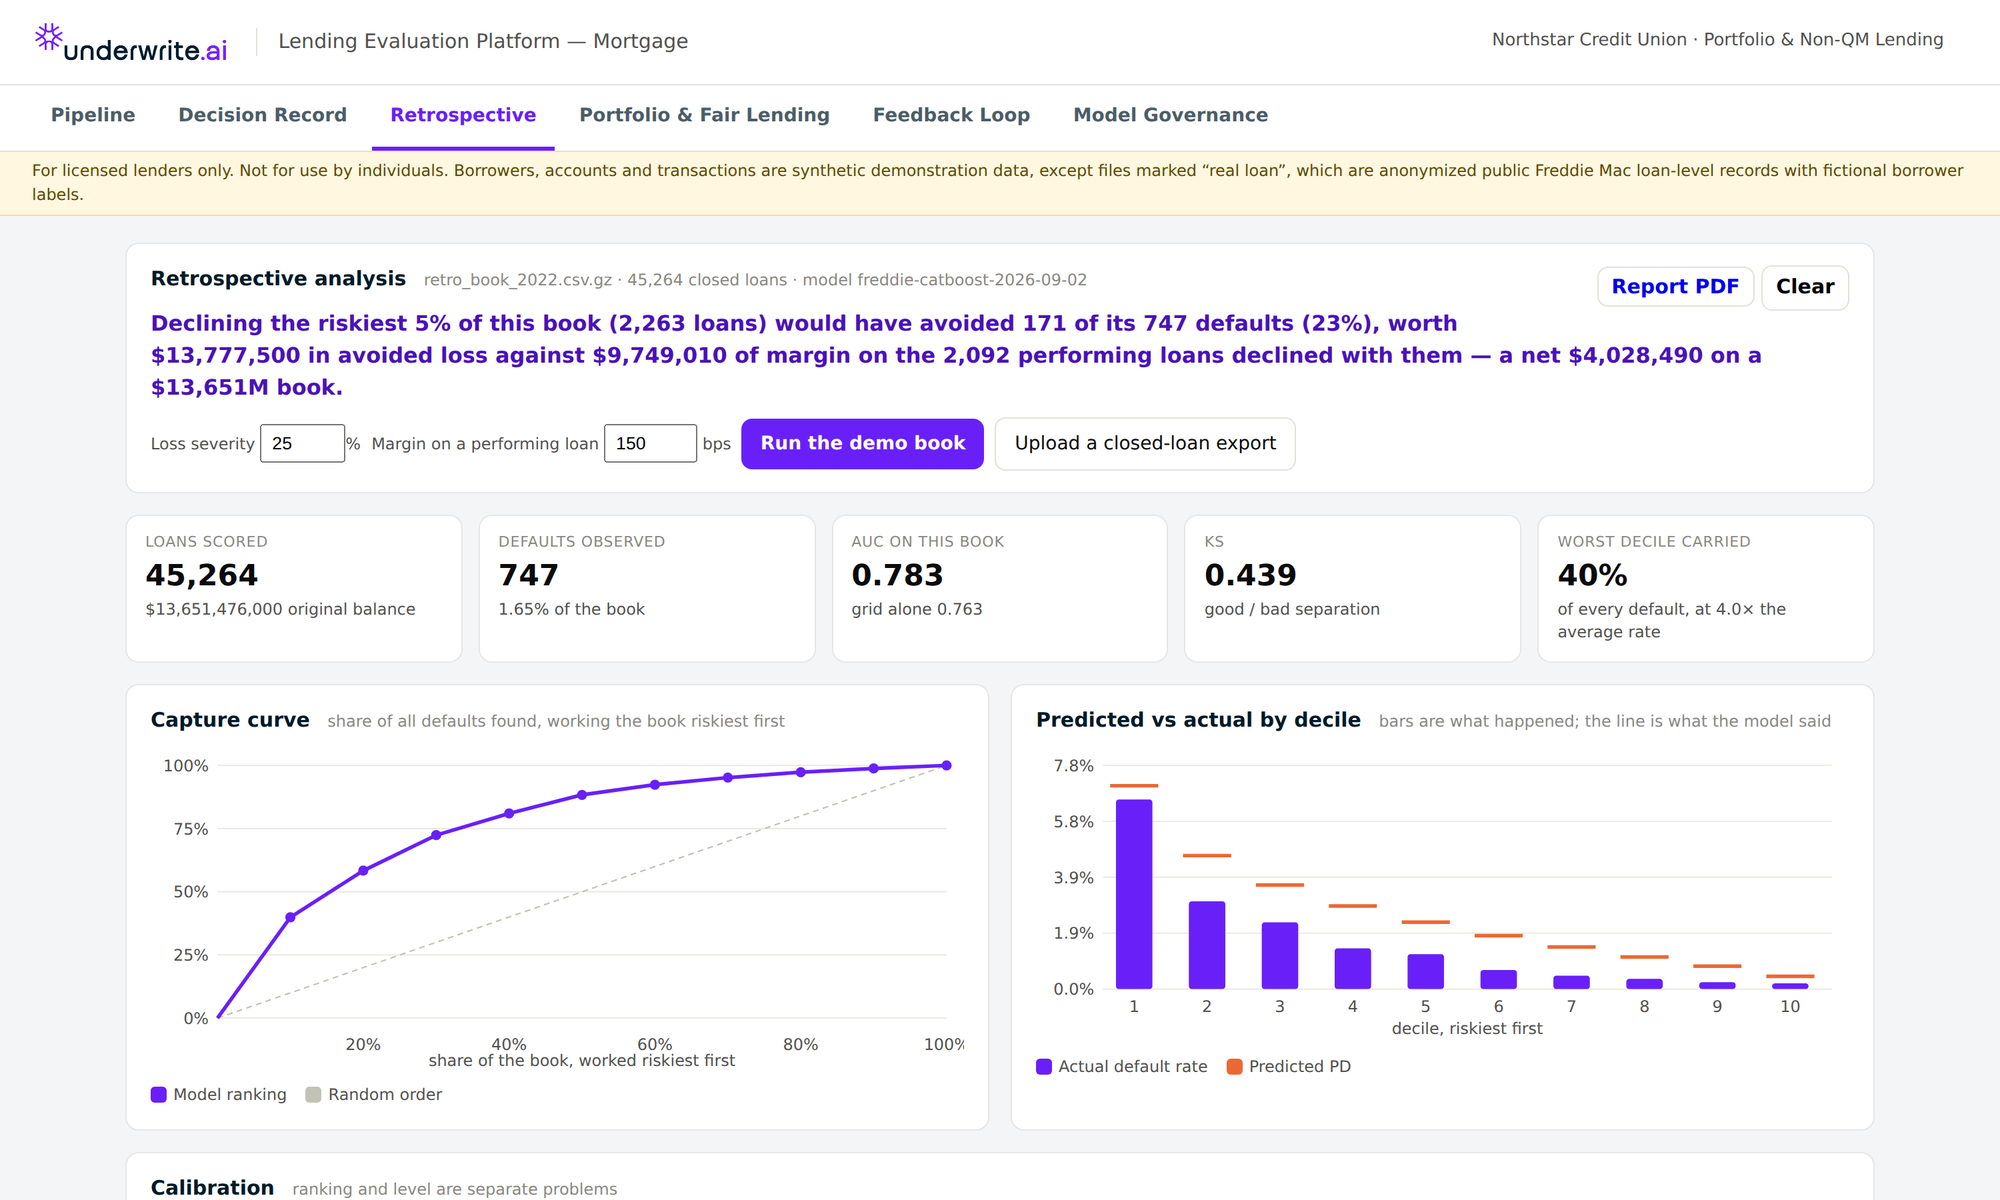
The capture curve shows what that looks like without a single number: work the book riskiest-first, and the model finds 40% of every default in the first tenth of the files.
- Your severity and margin assumptions. Both are inputs. Change them and every dollar figure re-runs.
- Any export. Column headers are matched automatically, ratios arriving as 0.80 are read as 80%, and every mapping decision is reported as read, assumed or missing.
- No demographic field is read at any point in the analysis.
It runs on the files you already produce
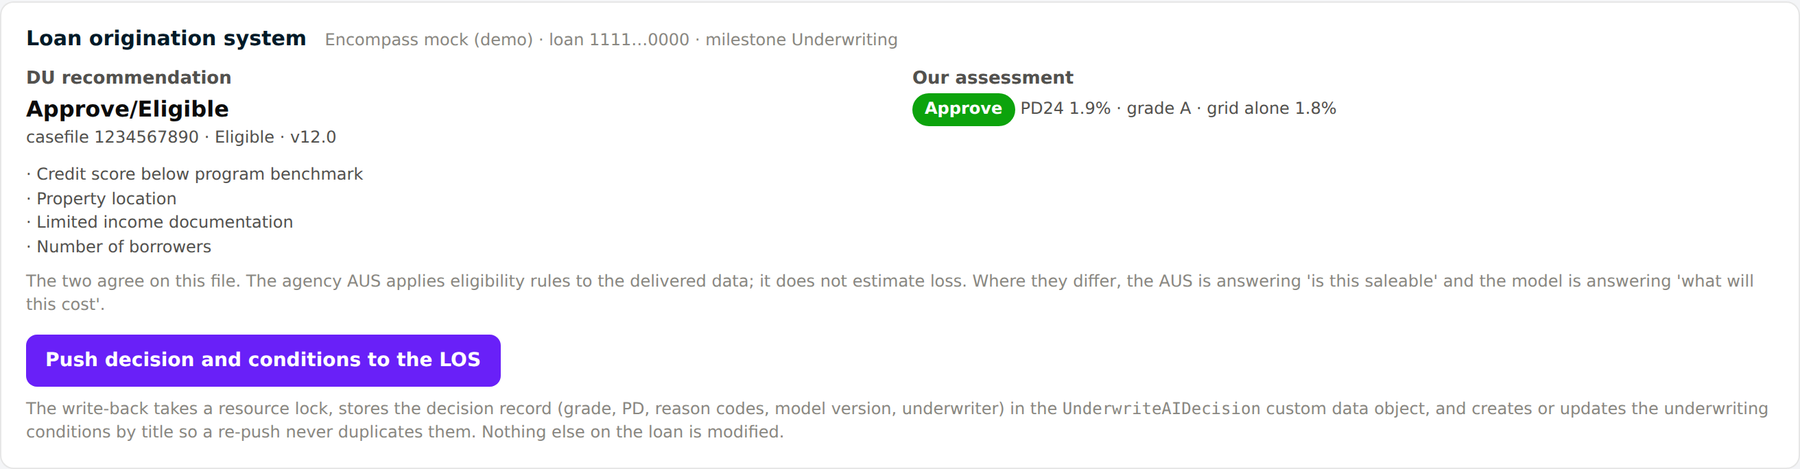
No new system of record, and no rip-and-replace. Loans arrive from your LOS or as the MISMO exports it already generates, and decisions go back the way they came.
- ICE Encompass via the documented Developer Connect API — pipeline, import, conditions, and the decision written back to a custom data object. Your own fields are never overwritten.
- MISMO 3.4 URLA — the same export your LOS produces for Desktop Underwriter — plus MISMO 2.4 credit and property records.
- Beside DU and LPA, not instead of them. The agency AUS asks whether a loan is saleable. The model asks what it will cost. Where they differ, you see both.
- Every import is auditable. The import record lists what was read from the file, what was inferred, and what is still missing.
Built to survive the review, not just the demo
The questions a model-risk officer and an information-security reviewer will ask have architectural answers, and they are verifiable rather than asserted.
No language model in any credit decision
Scoring, eligibility, conditions and reason codes are computed by deterministic code and a gradient-boosted model whose inputs are enumerated in the model card. The AI assistance layer can read engine outputs and draft text; it cannot change a score, a finding or a decision.
Consumer data stays in the account
The assistance layer runs Claude through Amazon Bedrock inside the same AWS account and region, reached over a private endpoint. No third-party AI API is ever called, Bedrock retains nothing, and every prompt and completion is logged to your own encrypted CloudWatch.
Tenant isolation the database enforces
Every row is keyed by tenant and Postgres row-level security pins each connection to one tenant, with the application running as a non-owner role — so isolation is enforced by the database, not by application code that could be wrong.
Champion / challenger, staged
The model learns from your servicing outcomes. A challenger must clear a cross-validated performance gate and a fairness screen before a human can promote it, by name and with a reason. Every promotion is reversible and the change log holds the history.
Fair lending, tested continuously
Adverse impact ratios, controlled disparity models with confidence intervals, override analysis and population stability — run on your book, not filed once a year. Demographic data is quarantined from the scorer, the rules and the agents entirely.
The examiner's pack, generated
Model card, validation, change control, governance map and assistance log export as a single PDF, mapped to SR 26-2, Fannie Mae LL-2026-04, Freddie Mac 1302.8 and the automated-decisioning rules effective January 2027.
A twelve-minute walkthrough of the whole platform
Every figure on screen is computed live by the engine — the pipeline, a clean approve, a refer on a policy exception, a decline with its adverse-action notice, the Encompass round trip, and the retrospective.
Questions we get asked
Your model was trained on other lenders' loans. Why would it work on ours?
Ranking transfers between lenders; the level does not. A model trained on an earlier, worse era will usually over-predict how often loans default on a newer book — on the public 2022 book above it over-predicts by 59%, and the report says so before anyone has to ask. Fitting the level to your book is what onboarding does. The retrospective is how you find out which part transfers before you commit to anything.
Does this replace Desktop Underwriter or Loan Product Advisor?
No, and it should not. The agency AUS applies eligibility rules to delivered data and answers whether a loan is saleable. It does not estimate loss. This runs beside it and answers a different question — what will this cost — which is why the platform shows both answers on the same screen and flags where they disagree.
What do you need from us to start?
One spreadsheet: your closed loans with origination attributes and what each loan went on to do. Not an API key, not an LOS integration, not an IT project. Column headers are matched automatically and everything the model assumed is reported back to you. That is deliberately the lowest-commitment first step we could design.
Does a language model make or influence the decision?
No. Scoring, eligibility, conditions and reason codes come from deterministic code and a gradient-boosted model whose inputs are listed in the model card. The AI assistance layer — the copilot, condition clearing, borrower follow-up, triage — can read engine outputs and draft text for a human to approve. It cannot change a score, a finding or a decision, and every run it makes is logged with the tools it called.
Where does our borrower data live?
Inside one AWS account and one region — ours for a shared deployment, or your own for a dedicated one. The AI layer runs through Amazon Bedrock inside that same account over a private endpoint, so no third-party AI API ever receives consumer data. The only external party that receives anything is the cash-flow aggregator your borrower consents to link. The reference deployment ships as Terraform your security team can read.
How is it priced?
Mortgage is sold as an annual platform licence sized to your volume, with onboarding that fits the model to your own book — separately from the per-decision pricing on our SMB and consumer plans, which is a different product for a different buyer. Start with a retrospective; we will quote once we both know what the model finds in your book.
Send us your last two years of closed loans
We will score every one as of its origination date, compare the score against what the loan actually did, and hand you the analysis — whether or not it makes the case for buying anything.
For licensed lenders. Not for use by individuals.